
What are Forex chart patterns?
Technical analysis involves examining price charts using chart patterns, forex indicators, and trading theories to determine the likely direction of price movement. This is a great way to find the best trade entries and exits in line with your bias.
Chart patterns are shapes or price presentations that indicate the likelihood of one outcome occurring in place of another. Retail traders around the world are using several forex trading chart patterns to make better trading and investment decisions. Like other technical analysis tools, chart patterns do not guarantee that a specific outcome will be obtained. Instead, they show what the most likely outcome is. This means that they can be used to predict price movement to a significant degree by considering how the market reacted to a specific pattern in the past.
Do Forex chart patterns work?
Yes, chart patterns work because they help traders have an edge in the forex market. An edge indicates a higher probability of one thing happening over another. This means many successful traders use chart patterns as trading strategies to make profits consistently.
To apply these patterns successfully, you have to study them and train yourself to find and analyze them with ease. You can also increase the probability of favorable outcomes by trading chart patterns with confluence.
2 Types of Forex Chart Patterns That People Use
There are two main types of chart patterns used by forex traders worldwide;
Reversal Patterns
Reversal patterns help traders determine when the market trend is likely to change. They’re used as confluence in line with other analysis tools to produce trading strategies with high win rates and risk to reward ratios.
Double Top/Bottom
Double tops are formed when the price reaches a level of resistance and fails to break through. This is observed when the buying pressure of buyers cannot overwhelm the sellers at a key price level. A double bottom is the opposite of a double top. It occurs when the price trades to a level of support and fails to break through. The failure to break the key level forms two tops or highs that show rejection from that level, meaning the term is likely to change.

This powerful chart pattern is easy to spot and take advantage of.
Head and Shoulders
The head and shoulders pattern occurs when the market structure fails to continue in the direction of the trend. This pattern can occur in a bullish or bearish environment.

A bullish head and shoulders pattern occurs when a downtrend trades to a key level and fails to create a lower low. This leads to the formation of a higher low which forms the head and shoulders pattern, signifying a market structure shift.
Wedge Patterns
Wedge patterns occur when the price of an asset is caught between two sloping trendlines. There are two types of wedge patterns; the falling wedge and the rising wedge.
A rising wedge is characterized by an asset’s price caught between two upwardly slanted support and resistance lines. The line above is the resistance, and the one below is the support. This usually indicates that the price of the asset will decline further.
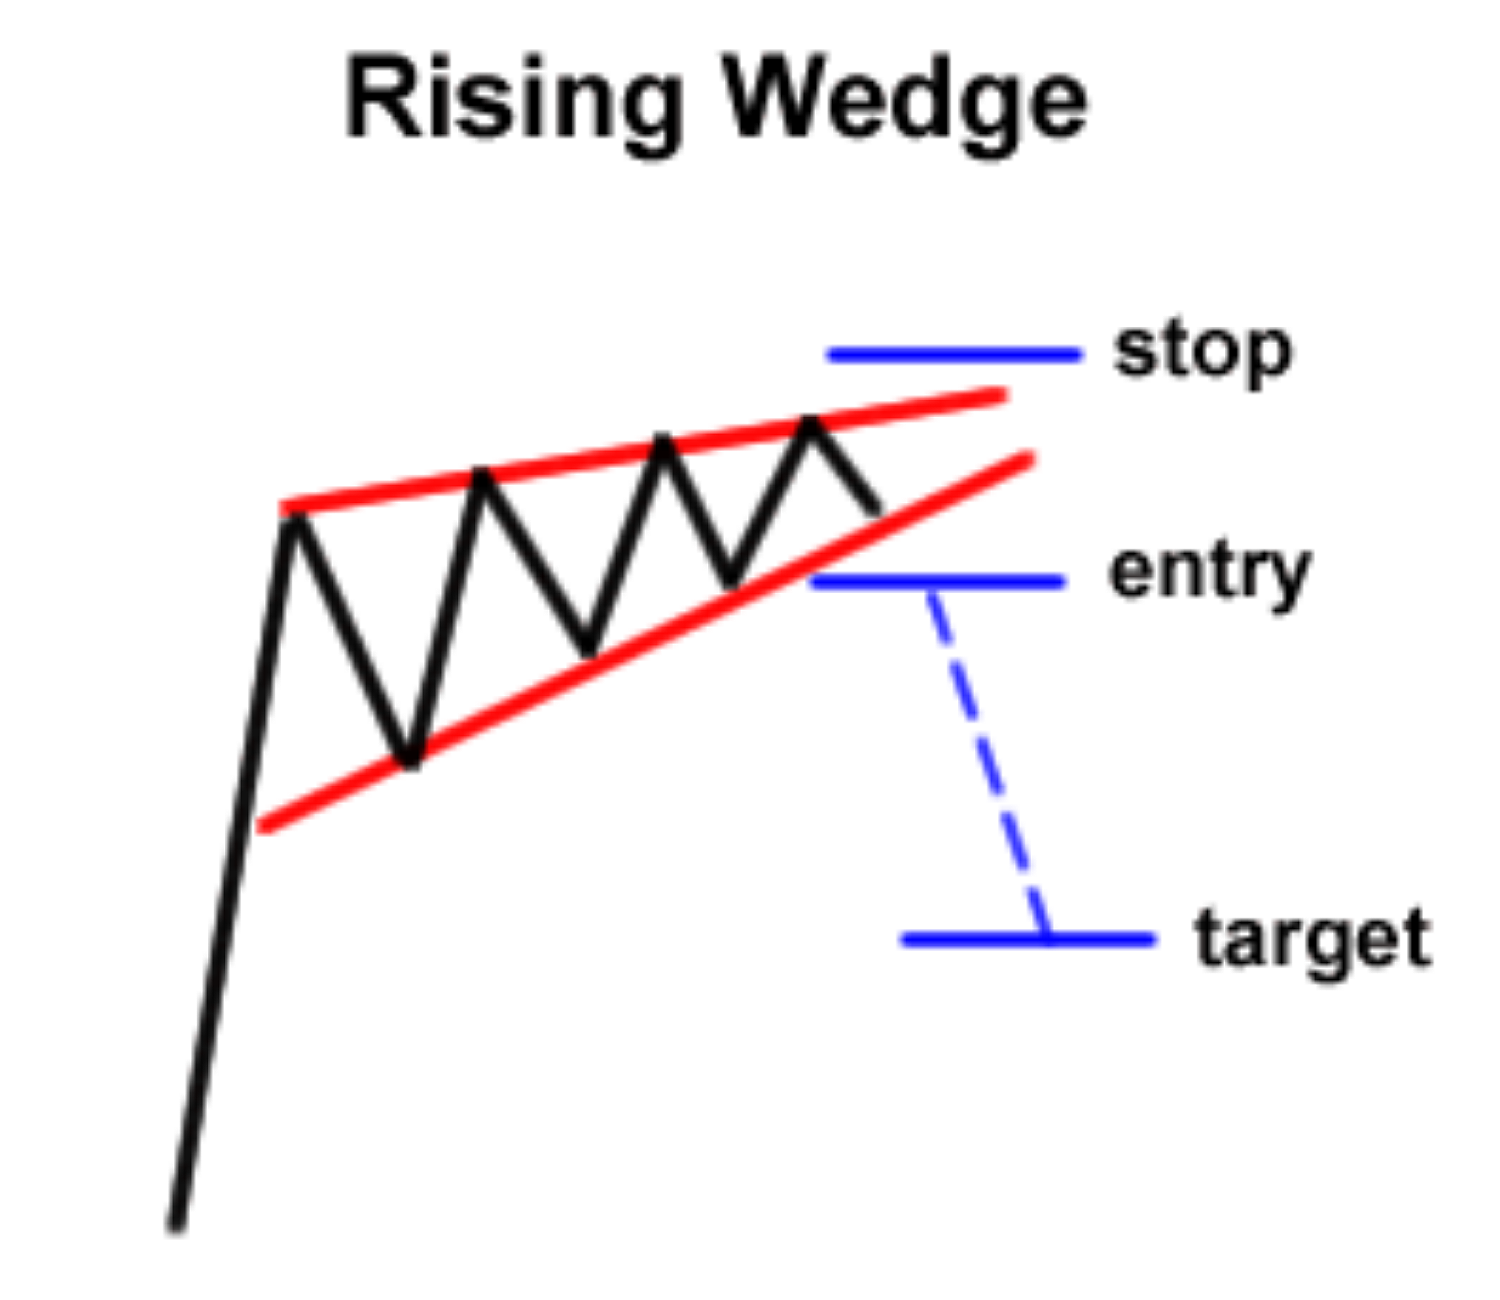
A rising wedge is characterized by an asset’s price caught between two downwardly sloping levels. The line above is the resistance, while the line below is the support. The asset’s price will most likely increase if it breaks through the resistance.
Don’t forget to place your stop loss order for proper risk management! A reasonable stop loss can be set around the middle of the chart formation.
Triple Tops/Bottoms
Triple tops occur when the price makes three peaks after trading to a key level. This shows the current momentum is fading, and the trend is likely to reverse. Triple bottoms occur when the price makes three valleys after trading to a key level. This shows the downtrend is getting weak and is likely to reverse.
Continuation Patterns
Continuation patterns signal that an ongoing trend will continue.
Rectangle Pattern
A rectangle pattern occurs when an asset is bound by horizontal support and resistance levels. Price eventually breaks out and might continue in the direction of the trend.
Pennant
Pennants occur when a trend pauses for a short period before continuing the impulsive moves. They form in the shape of triangles and often lead to explosive moves after the period of contraction.

For continuation patterns, stops are usually placed above or below the actual chart formation.
How to Read Forex Chart Patterns
If you want to trade chart patterns successfully, here are four steps to reading them accurately.
Analyse the Price Charts
Before trading these patterns, you need to check the charts and find them at key levels. This is very important because many new traders lose money by trading the patterns at random price points. If you’re new to this style of trading, make sure you practice regularly and train yourself to identify and trade these patterns with ease.
Understand the Reasoning behind Each Pattern
It’s great to know what these chart patterns look like, but understanding the reasons behind them is even better. This knowledge helps you apply and interpret them better and make informed trading decisions. For instance, a head and shoulders pattern isn’t just the failure of price to create a lower high or low. It’s the inability of buyers and sellers to move beyond a key level – one that’s confirmed by a break of structure or a break of the ‘neckline.’
Evaluate the risk/reward ratio of the Pattern
Like other trading strategies, chart patterns have varying risk to reward ratios, depending on the profit potential presented by each trading opportunity. Make sure you execute trades with enough risk to reward ratio to profit from.

Trade With Confluence
Confluence refers to trade confirmations or a variety of factors that support a trade idea. While trading chart patterns, you can apply forms of confluence to improve your win rate and trade outcomes.
Tips to Remember When Trading Forex Chart Patterns
Use Proper Risk Management
Always outline your risk management parameters by deciding how much you’re willing to lose before executing your trades. Predetermine the percentage of your capital that you’re willing to risk on each trade and control your losses with stop loss orders. A stop loss is an order that permits the broker to close out your trades when price trades to a specific point that will invalidate your trade idea.
Follow Your Trading Rules
While using forex trading patterns, you should make trading rules that will show you how to execute trades and manage them appropriately. For instance, while trading patterns like head and shoulders, you can create rules regarding your entry criteria. Aggressive traders like to enter upon the break of the ‘neckline’ while others wait for a retracement. Having clear-cut rules ensures that your emotions are kept in check because you’ll remain disciplined.
Keep it Simple
Having a simple strategy is a great way to get better results with chart patterns. Forex trading can be demanding and emotionally tasking, but simplicity helps you declutter your mind and follow your rule-based strategy. Don’t mistake a complicated strategy for a profitable one. Chart patterns are a great addition to most trading styles but keep your trading simple regardless.
Know more about reading Forex chart patterns with Decode Global
Chart patterns can be found on price charts available on many forex trading platforms. These platforms may also provide tools for technical and fundamental analysis of the forex market. If you’re serious about improving your understanding of these price action patterns, open a trading account and start learning today!